CS立体図の色合いを本家に近づけてみた
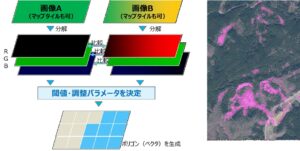
微地形表現図のひとつであるCS立体図は、特許フリーということもあり、いろいろな業者さんが制作できます。また、作成ツールとしては、ArcGISのプラグイン(森林総合研究所)やFMEワークスペース(Pacific Spatial Solutions社)のほか、みんな大好きQGISプラグイン(MIERUNE社)などがあります。
これは、誰でもCS立体図を作成できるというメリットがある一方、製作者×ツールの組み合わせで、いろんな色合いができてしまう、というデメリットも抱えています。具体例としても、林野庁がG空間情報センターで公開するCS立体図も、なんかコントラストが低い、コントラスト上げたら影だけできて、鮮やかさは増えない、、、などのモヤを感じるところです。色合いの定義を放置することは、例えば、災害前後のデータを見比べるときに色の違いがノイズになるとか、機械学習で路網判読させようと思ったときに、教師データがマッチしないという課題もあるでしょう。
そのような中、昨年のFoss4G SHINSHUにおいて、CS立体図の生みの親であるジオ・フォレスト株式会社の戸田さんに、「結局、CS立体図の色ってどれがお勧めなんですか。」とお尋ねしたところ、「FME版のマニュアルに各レイヤの色設定や配合の方法が書いてあるから、それに準拠するのがよい。」という回答をいただきました。
今回やったこと
一番誰でも使えるツールであるMIERUNEさんのQGISプラグインをチューニングし、本家の色合いに近づけてみました。(MIERUNEさん、勝手にごめんなさい。後で連絡します。)
実は、このプラグインは、先ほど書いたモヤモヤ、林野庁が公開するCS立体図の作成にも使われているので、ここをちゃんと整えるというのは、今後の公開データの質的向上にも期待が持てると考えたところです。
色合い比較
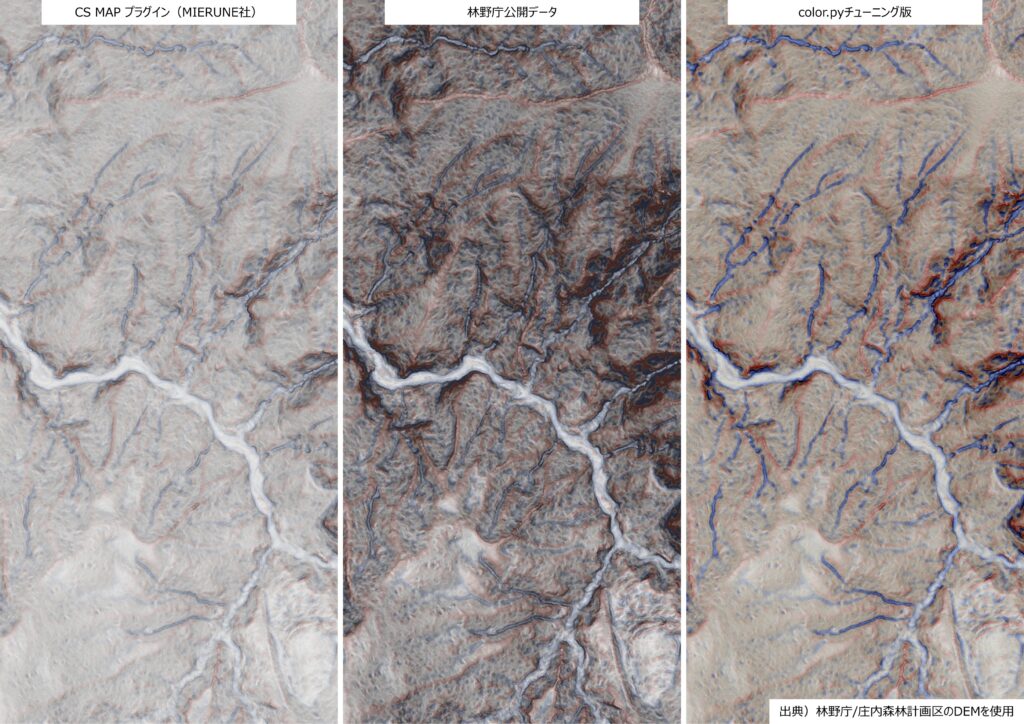
左から順番に、プラグインの初期値→林野庁公開データ→今回のチューニング版です。
チューニングをしたことにより、初期値では淡いから頑張って変えようとして暗くなる、、、というトンネルから抜け、青・赤に加え、黄色味もちゃんとある本家らしい色合いになりました。
チューニングの内容
QGISプラグインのパッケージ内にあるpythonコードのうち、次の3点をチューニングしました。
- 色合いの設定を書いてあるcolor.pyを全面的に書き換え、FME版マニュアルの色合いを定義
- 画像合成のプロセスを書く、process.pyにマニュアルの初期値を与える
- プラグインのUIを書く、csmap_algorithm.pyの初期入力値を、マニュアル初期値に書き換える
なお、3番目はQGIS上でUIを操作する際に、自分で毎回打ち直すのであれば、不要な修正であり、最小限としては、color.pyとprocess.pyの2点です。以下に保存されているpyコードを置き換えるだけ、とお手軽です。
C:\Users\ユーザ名\AppData\Roaming\QGIS\QGIS3\profiles\default\python\plugins\csmap-qgis-plugin-main\csmap_py\csmapcolor.py(全面書き換え)
import numpy as np

def normalize(arr, scale):
    _min, _max = scale
    denom = _max - _min
    if denom == 0:
        return np.zeros_like(arr, dtype=np.float32)
    arr = (arr - _min) / denom
    return np.clip(arr, 0, 1)

# =========================
# LUT(Look-Up Table)生成
# =========================
def make_lut(colors):
    colors = np.array(colors, dtype=np.float32)

    if len(colors) == 2
        t = np.linspace(0, 1, 256)[:, None]
        lut = colors[0] * (1 - t) + colors[1] * t

    elif len(colors) == 3:
        lut = np.zeros((256, 3))
        for i in range(256):
            t = i / 255
            if t < 0.5:
                tt = t * 2
                lut[i] = colors[0] * (1 - tt) + colors[1] * tt
            else:
                tt = (t - 0.5) * 2
                lut[i] = colors[1] * (1 - tt) + colors[2] * tt
    else:
        raise ValueError("Only 2 or 3 colors supported")

    return lut.astype(np.uint8)

# =========================
# マニュアル仕様のカラーパレット
# =========================
LUT_HEIGHT = make_lut([(36, 36, 36), (246, 246, 246)])
LUT_SLOPE_RED = make_lut([(247, 213, 213), (134, 28, 33)])
LUT_SLOPE_BW = make_lut([(246, 246, 246), (36, 36, 36)])
LUT_CURV_BLUE = make_lut([(42, 95, 131), (208, 223, 230)])
LUT_CURV_RYB = make_lut([(50, 96, 207), (255, 254, 190), (198, 72, 59)])

# =========================
# LUT適用
# =========================
def apply_lut(arr, lut):
    idx = (arr * 255).astype(np.uint8)
    rgb = lut[idx]  # shape (H, W, 3)
    return np.transpose(rgb, (2, 0, 1))

# =========================
# RGB化
# =========================
def rgbify(arr, lut, scale):
    arr = normalize(arr, scale
    rgb = apply_lut(arr, lut)

    rgba = np.zeros((4, arr.shape[0], arr.shape[1]), dtype=np.uint8)
    rgba[:3] = rgb
    rgba[3] = 255
    return rgba

# =========================
# 色の鮮明化
# =========================
def stretch_rgb(rgb):
    ranges = [
        (65, 234),
        (57, 229),
        (66, 216),
    ]

    out = rgb.astype(np.float32)

    for i, (mn, mx) in enumerate(ranges):
        out[i] = (out[i] - mn) / (mx - mn) * 255

    return np.clip(out, 0, 255).astype(np.uint8)

# =========================
# ブレンド比率
# =========================
def blend(dem, slope_red, slope_bw, curvature_blue, curvature_ryb):
    blend = (
        dem.astype(np.float32) * 0.125
        + slope_red.astype(np.float32) * 0.25
        + slope_bw.astype(np.float32) * 0.25
        + curvature_blue.astype(np.float32) * 0.125
        + curvature_ryb.astype(np.float32) * 0.25
    )

    blend = np.clip(blend, 0, 255).astype(np.uint8)
    blend = stretch_rgb(blend)

    blend[3] = 255
return blendprocess.py(黄色ハイライトを修正)
from concurrent import futures
from dataclasses import dataclass
from threading import Lock

import numpy as np
import rasterio
from rasterio.transform import Affine
from rasterio.windows import Window

from . import calc, color


@dataclass
class CsmapParams:
    gf_size: int = 12
    gf_sigma: int = 3
    curvature_size: int = 1
    height_scale: tuple[float, float] = (200.0, 2000.0)# ← 範囲変更
    slope_scale: tuple[float, float] = (0.0, 1.047)# ← 範囲変更
    curvature_scale: tuple[float, float] = (-0.1, 0.1)


def csmap(dem: np.ndarray, params: CsmapParams) -> np.ndarray:
    """DEMからCS立体図を作成する"""
    # calclucate elements
    slope = calc.slope(dem)
    g = calc.gaussianfilter(dem, params.gf_size, params.gf_sigma)
    curvature = calc.curvature(g, params.curvature_size)

    # height_blackwhiteからLUT_HEIGHに変更
    dem_rgb = color.rgbify(dem, color.LUT_HEIGHT, scale=params.height_scale)

    slope_red = color.rgbify(slope, color.LUT_SLOPE_RED, scale=params.slope_scale)
    slope_bw  = color.rgbify(slope, color.LUT_SLOPE_BW, scale=params.slope_scale)

    curvature_blue = color.rgbify(curvature, color.LUT_CURV_BLUE, scale=params.curvature_scale)
    curvature_ryb  = color.rgbify(curvature, color.LUT_CURV_RYB, scale=params.curvature_scale)

    dem_rgb = dem_rgb[:, 1:-1, 1:-1]  # remove padding

    # blend all rgb
    blend = color.blend(
        dem_rgb,
        slope_red,
        slope_bw,
        curvature_blue,
        curvature_ryb,
    )

    return blend


def _process_chunk(
    chunk: np.ndarray,
    dst: rasterio.io.DatasetWriter,
    x: int,
    y: int,
    write_size_x: int,
    write_size_y: int,
    params: CsmapParams,
    lock: Lock = None,
) -> np.ndarray:
    """チャンクごとの処理"""
    csmap_chunk = csmap(chunk, params)
    csmap_chunk_margin_removed = csmap_chunk[
        :,
        (params.gf_size + params.gf_sigma) // 2 : -(
            (params.gf_size + params.gf_sigma) // 2
        ),
        (params.gf_size + params.gf_sigma) // 2 : -(
            (params.gf_size + params.gf_sigma) // 2
        ),
    ]  # shape = (4, chunk_size - margin, chunk_size - margin)

    if lock is None:
        dst.write(
            csmap_chunk_margin_removed,
            window=Window(x, y, write_size_x, write_size_y),
        )
    else:
        with lock:
            dst.write(
                csmap_chunk_margin_removed,
                window=Window(x, y, write_size_x, write_size_y),
            )


def process(
    input_dem_path: str,
    output_path: str,
    chunk_size: int,
    params: CsmapParams,
    max_workers: int = 1,
):
    with rasterio.open(input_dem_path) as dem:
        margin = params.gf_size + params.gf_sigma  # ガウシアンフィルタのサイズ+シグマ
        # チャンクごとの処理結果には「淵=margin」が生じるのでこの部分を除外する必要がある
        margin_to_removed = margin // 2  # 整数値に切り捨てた値*両端

        # マージンを考慮したtransform
        transform = Affine(
            dem.transform.a,
            dem.transform.b,
            dem.transform.c
            + (1 + margin // 2) * dem.transform.a,  # 左端の座標をマージン分ずらす
            dem.transform.d,
            dem.transform.e,
            dem.transform.f
            + (1 + margin // 2) * dem.transform.e,  # 上端の座標をマージン分ずらす
        )

        # 生成されるCS立体図のサイズ
        out_width = dem.shape[1] - margin_to_removed * 2 - 2
        out_height = dem.shape[0] - margin_to_removed * 2 - 2

        with rasterio.open(
            output_path,
            "w",
            driver="GTiff",
            dtype=rasterio.uint8,
            count=4,
            width=out_width,
            height=out_height,
            crs=dem.crs,
            transform=transform,
            compress="LZW",
        ) as dst:
            # chunkごとに処理
            chunk_csmap_size = chunk_size - margin_to_removed * 2 - 2

            # 並列処理しない場合とする場合で処理を分ける
            if max_workers == 1:
                for y in range(0, dem.shape[0], chunk_csmap_size):
                    for x in range(0, dem.shape[1], chunk_csmap_size):
                        # csmpのどの部分を出力用配列に入れるかを計算
                        write_size_x = chunk_csmap_size
                        write_size_y = chunk_csmap_size
                        if x + chunk_csmap_size > out_width:
                            write_size_x = out_width - x
                        if y + chunk_csmap_size > out_height:
                            write_size_y = out_height - y

                        chunk = dem.read(1, window=Window(x, y, chunk_size, chunk_size))
                        _process_chunk(
                            chunk,
                            dst,
                            x,
                            y,
                            write_size_x,
                            write_size_y,
                            params,
                        )
            else:  # 並列処理する場合=ThreadPoolExecutorを使用する
                lock = Lock()  # 並列処理のロック
                with futures.ThreadPoolExecutor(max_workers=max_workers) as executor:
                    # chunkごとに処理
                    for y in range(0, dem.shape[0], chunk_csmap_size):
                        for x in range(0, dem.shape[1], chunk_csmap_size):
                            # csmpのどの部分を出力用配列に入れるかを計算
                            write_size_x = chunk_csmap_size
                            write_size_y = chunk_csmap_size
                            if x + chunk_csmap_size > out_width:
                                write_size_x = out_width - x
                            if y + chunk_csmap_size > out_height:
                                write_size_y = out_height - y

                            chunk = dem.read(
                                1, window=Window(x, y, chunk_size, chunk_size)
                            )
                            executor.submit(
                                _process_chunk,
                                chunk,
                                dst,
                                x,
                                y,
                                write_size_x,
                                write_size_y,
                                params,
                                lock,
                            )